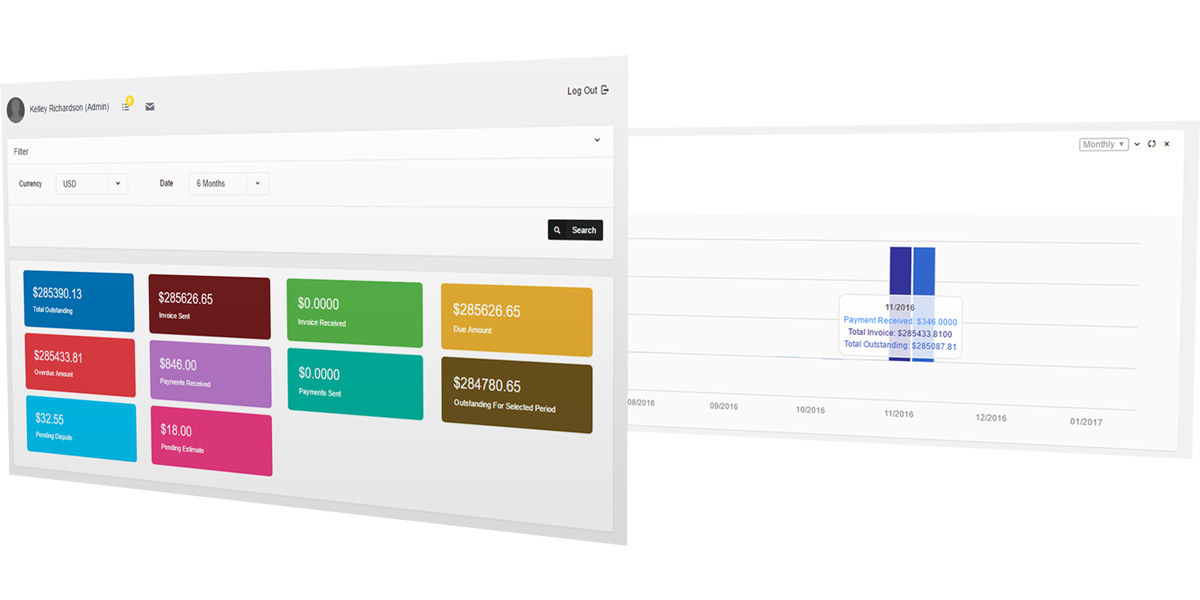
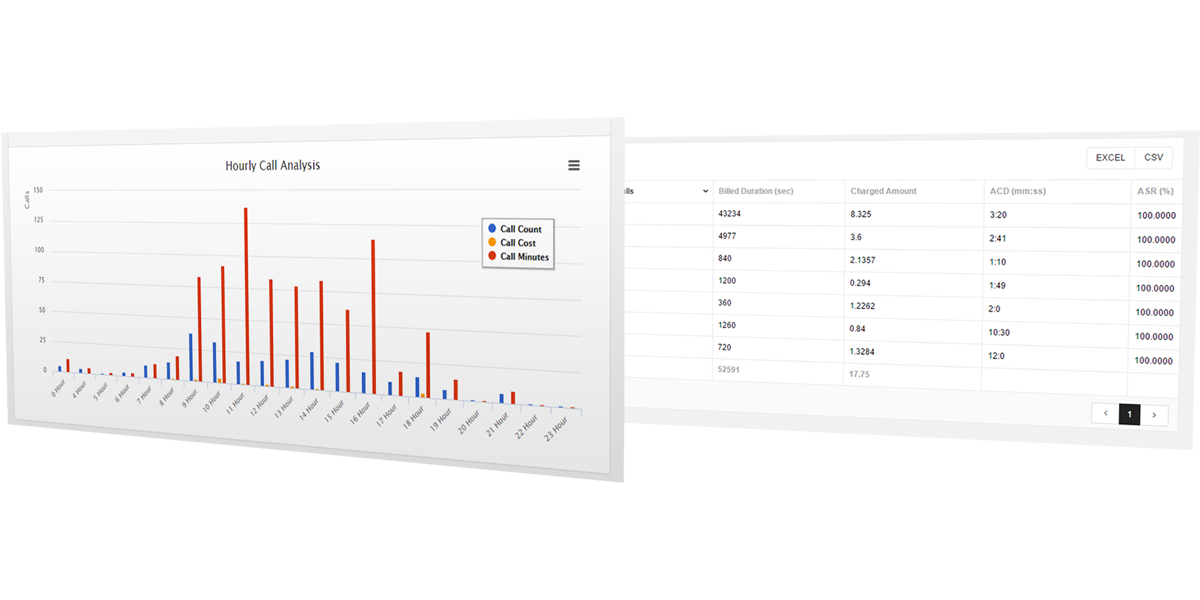
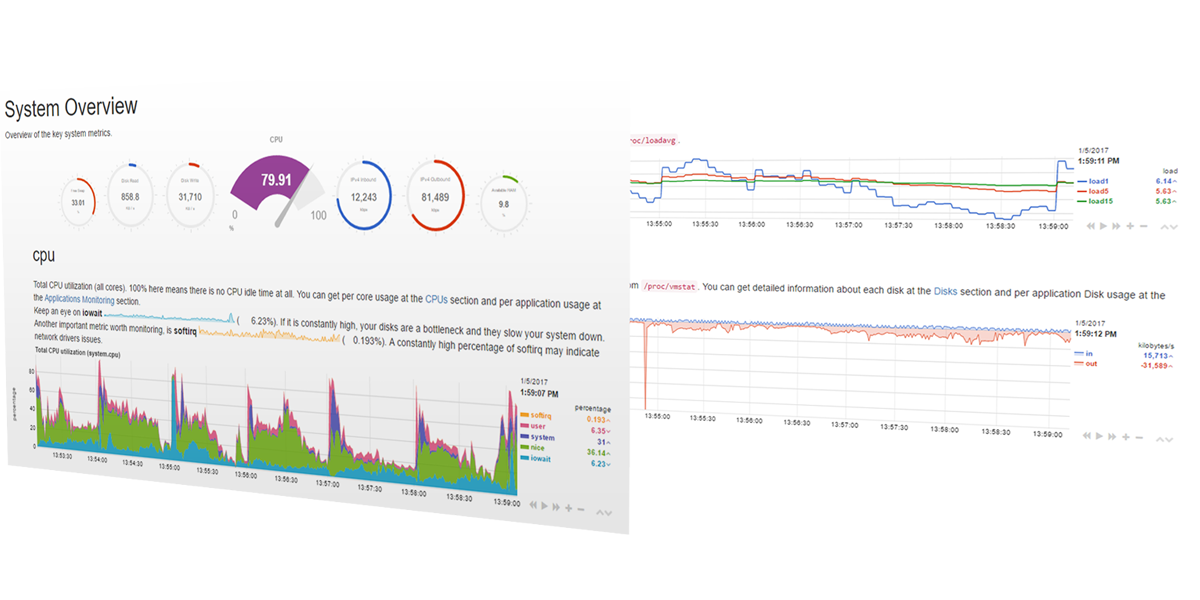
Beyond the live ASR, ACD, and QoS dashboards used for day-to-day traffic monitoring, Neon Soft's reporting suite adds destination- and prefix-level breakdowns, customizable CDR and revenue reports, and scheduled report delivery, giving you both real-time operational visibility and structured periodic reporting for stakeholders who don't need to watch a live dashboard.
You can configure automated notifications for anomalies including QoS drops, unusual ASR/ACD shifts, and specific events like the longest or most expensive calls in a period, so exceptions surface immediately instead of being discovered at invoice time.
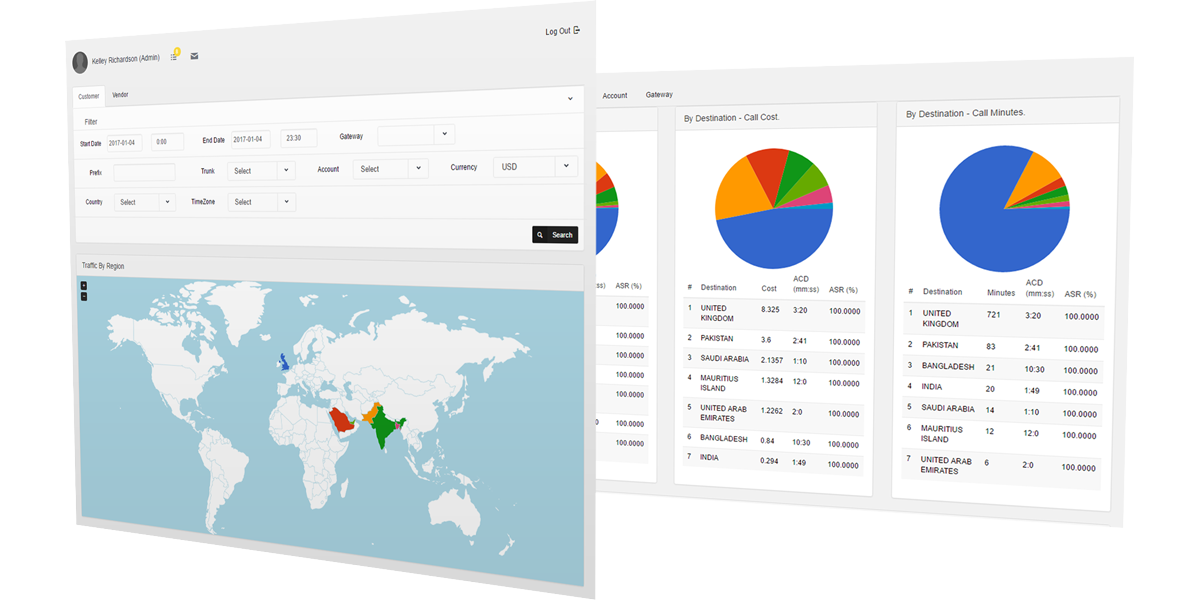
Yes, reports can be filtered and aggregated by destination, prefix, gateway, and trunk, letting you analyze traffic and revenue at the granularity of a single route rather than only at the account or customer level.
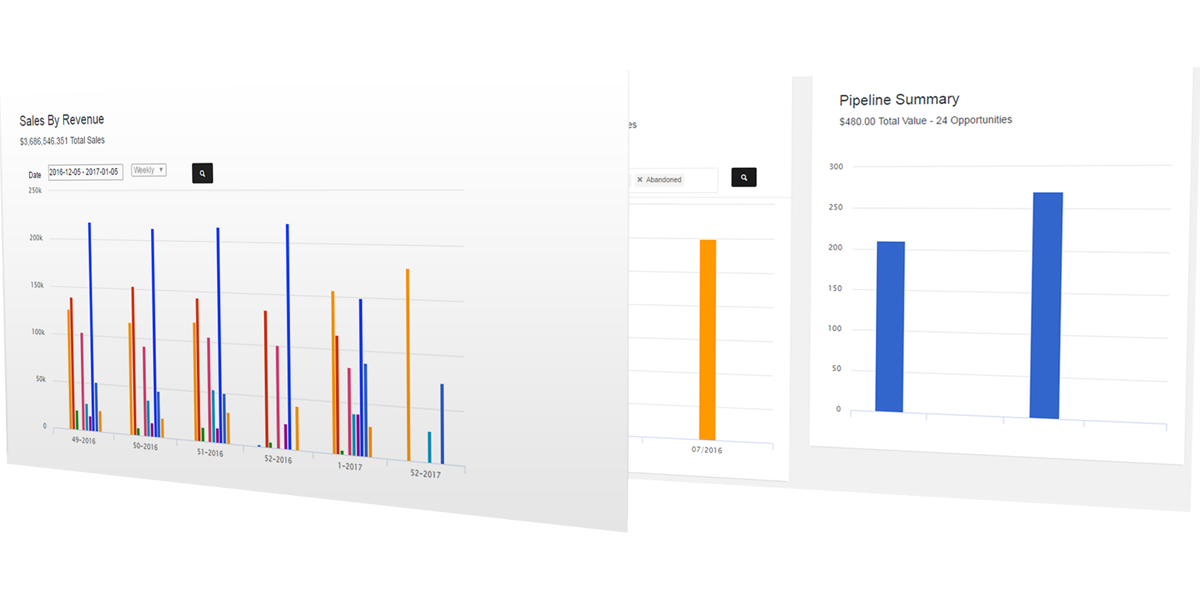
Neon Soft generates granular CDR reports alongside custom reports for user analytics, revenue, and operational performance. Reports can be scheduled to run automatically and delivered on a recurring basis rather than pulled manually each time.
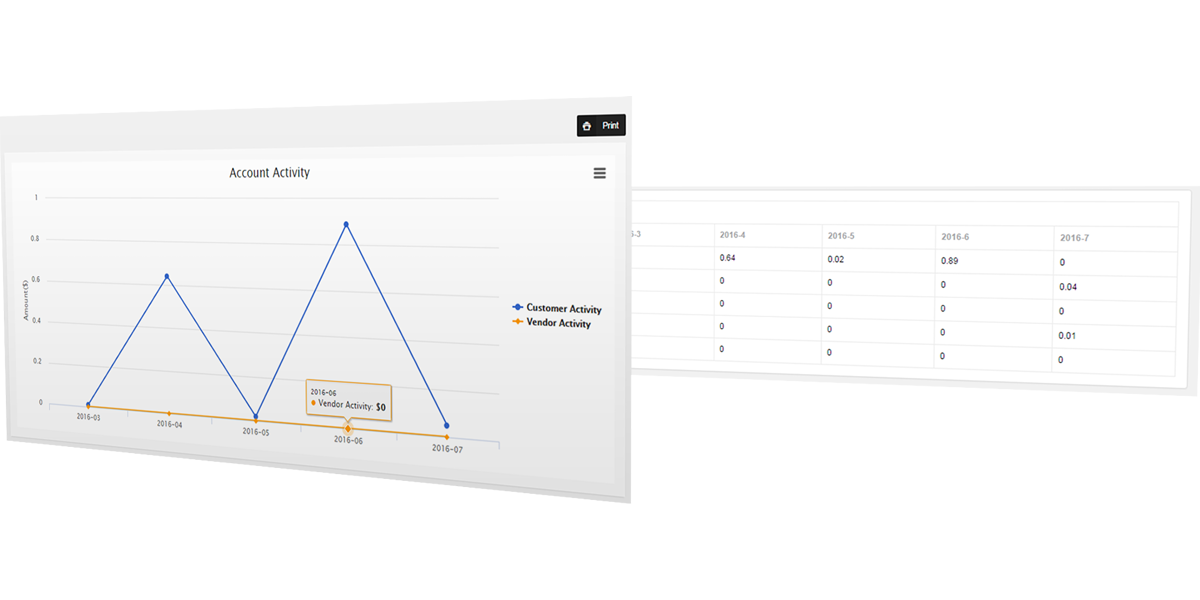
Yes, dashboards aggregate stats for both customer and vendor usage side by side, which is what lets wholesale operators compare what they're being charged by vendors against what they're billing customers on the same routes.